DELVE (DECam Local Volume Exploration) Survey
Description
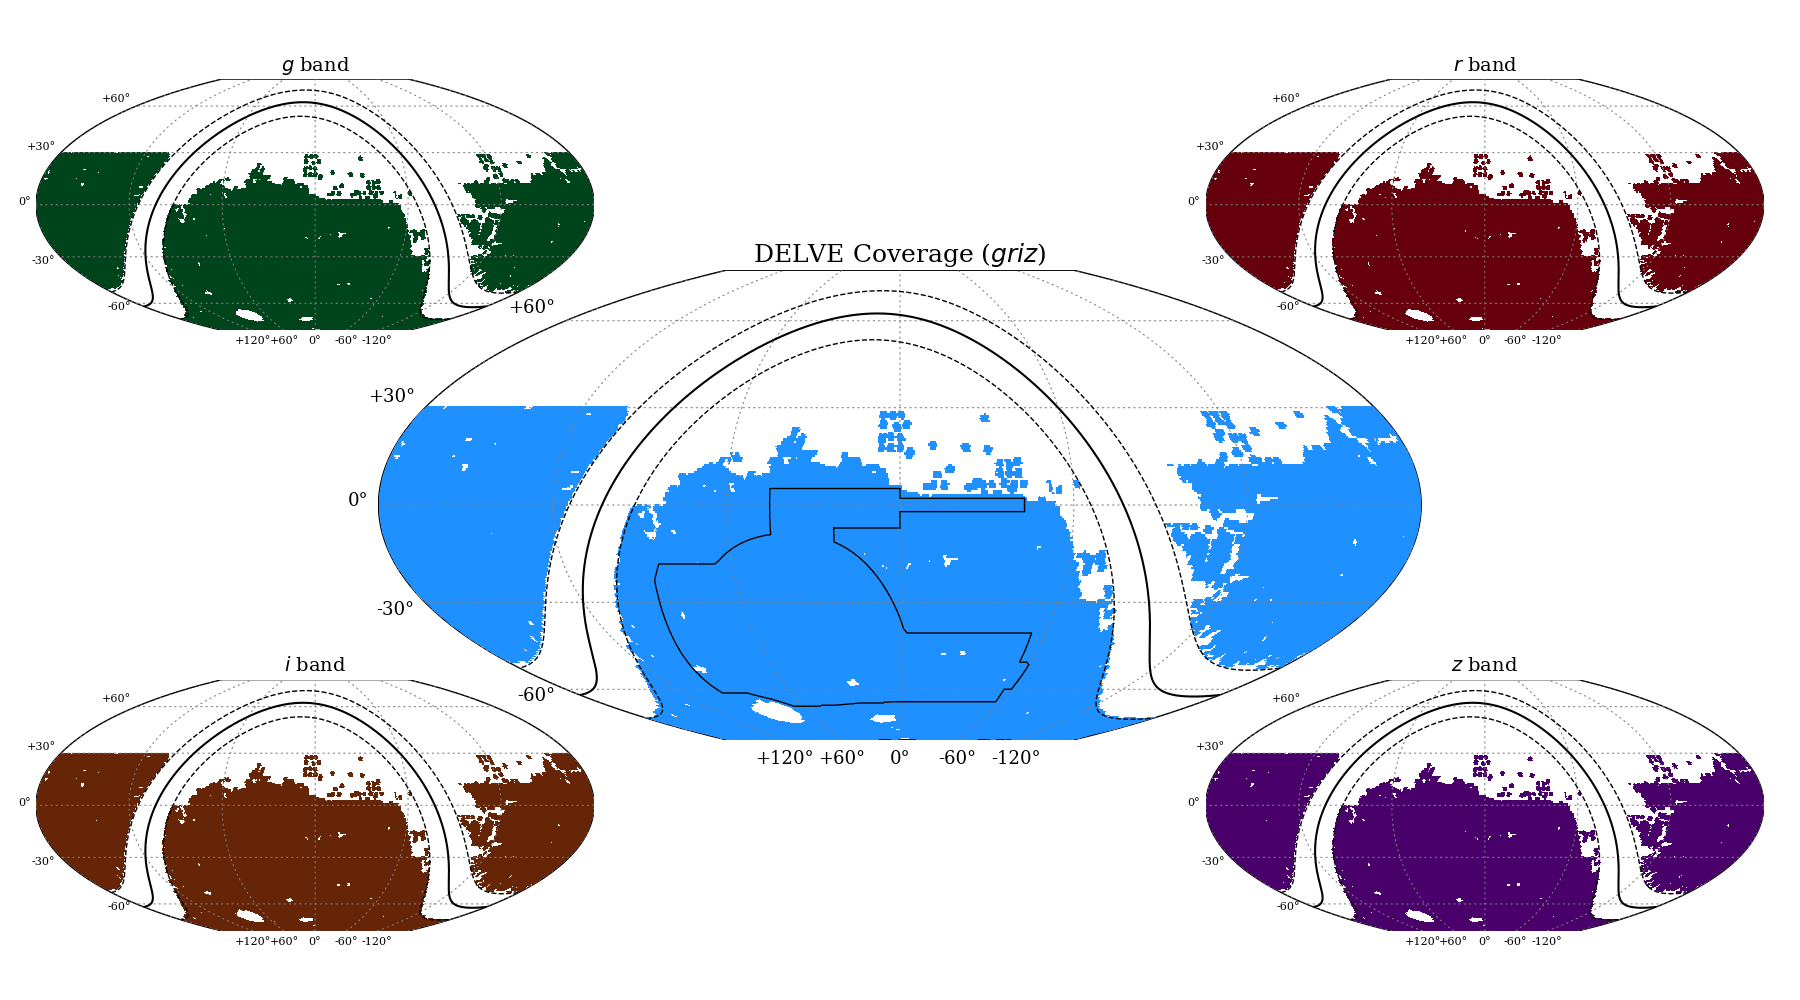
The DECam Local Volume Exploration Survey (DELVE; PropID: 2019A-0305) combines archival DECam data with more than 150 nights of new observations to study satellite dwarf galaxies over a wide range of luminosities and environments. DELVE is divided into three survey components (WIDE, MC, and DEEP), each of which have their own observational strategy and data reduction pipeline. By combining novel observations with existing data from DES, DECaLS, and other community programs, DELVE provides complete contiguous DECam coverage of the entire high-Galactic-latitude southern sky. DELVE covers >20,000 deg² to a 10σ depth of griz ∼23.5 mag, ∼2,200 deg² around the Magellanic Clouds to a depth of gri ∼24.5 mag, and ∼135 deg² around isolated Magellanic analogs in the Local Volume to a depth of gi ∼25.5 mag.
For more complete information about DELVE, please visit: https://delve-survey.github.io. For a list of results from the DELVE Collaboration and using the DELVE data, visit https://delve-survey.github.io/#papers.
To date, there have been three DELVE data releases (DR1, DR2, DR3). The delve_dr3.coadd_objects table represents the deepest and most recent catalog. The delve_dr2.objects table and delve_dr1.objects table have been crossmatched against our default reference datasets within a 1.5 arcsec radius, nearest neighbor only. These tables will appear with x1p5 in their name in our table browser. Example: delve_dr2.x1p5__objects__gaia_dr3__gaia_source.
| DELVE at a Glance | |||
|---|---|---|---|
| Survey | Area | Bands | Depth |
| DELVE-WIDE | ∼20,000 deg² | griz | ∼23.5 mag |
| DELVE-MC | ∼2,200 deg² | gri | ∼24.5 mag |
| DELVE-DEEP | ∼135 deg² | gi | ∼25.5 mag |
DELVE Coverage Map
Scientific Goals
DELVE seeks to understand the faintest and most dark-matter-dominated galaxies in a range of environments. The DELVE data enable the detection and characterization of dwarf galaxies over a broad range of luminosity, extending from the ultra-faint satellites of the Milky Way (L ∼ 10³L⊙) to analogs of the Magellanic Clouds (L ∼ 10⁹⁻¹⁰ L⊙) in the Local Volume. DELVE consists of:
- DELVE-WIDE: a high-Galactic-latitude wide-area survey focused on resolved stellar systems (e.g., ultra-faint satellite galaxies and stellar streams) in the Milky Way halo.
- DELVE-MC: a contiguous Magellanic Cloud periphery survey to study the structure, evolution, star formation history, and satellite population of the Magellanic Clouds.
- DELVE-DEEP: a deep targeted survey of Magellanic Cloud analogs (Sextans B, NGC 55, NGC 300, IC 5152) in the Local Volume to study the satellite populations of isolated low-mass hosts.
These three survey components will provide complementary insights into the abundance and properties of satellite galaxies around hosts at different mass scales and in a variety of environments. Combined with a unified theoretical framework, DELVE seeks to explore the dependence of satellite properties on reionization, host halo properties, and environment, in order to offer insights into the galaxy–halo connection. More information about DELVE can be found at: https://delve-survey.github.io/.
Data Releases
DELVE DR3
The third DELVE data release (DELVE DR3; Drlica-Wagner et al., in prep) consists of coadded images and catalogs in griz from the DECam All Data Everywhere (DECADE) and DES DR2 processing at NCSA using the DES Data Management (DESDM) pipeline. The DELVE DR3 coadd object catalog contains ∼2.6 billion unique coadd objects and covers ∼20,000 deg² in all four bands simultaneously. The DELVE DR3 coadd objects can be accessed through the delve_dr3.coadd_objects table.
| DELVE DR3 Summary | |
|---|---|
| Bands | griz |
| Number of Objects | 2,588,267,795 |
| Area Covered (all bands) | 20,000 deg² |
| Depth (5σ PSF; griz) | 24.9, 24.5, 24.0, 23.5 mag |
| Depth (5σ AUTO; griz) | 24.3, 24.0, 23.5, 22.8 mag |
DELVE DR3 DECADE Cosmic Shear
Data products associated with the DECADE cosmic shear program (i.e., Anbajagane et al. 2025) are coming soon!
DELVE DR2
The second DELVE data release (DELVE DR2; Drlica-Wagner et al. 2022) consists of catalog-level coadds in griz from the DELVE-WIDE processing. DELVE DR2 covers >20,000 deg² in each individual band and ∼17,000 deg² in all bands simultaneously. The DELVE DR2 catalog contains ∼2.5 billion unique objects, and ∼618 million unique objects that were observed in all four bands. The DELVE DR2 catalog-level coadd objects can be accessed through the delve_dr2.objects table.
| DELVE DR2 Summary | |
|---|---|
| Bands | griz |
| Number of Objects | 2,500,247,752 |
| Area Covered (all bands) | 16,972 deg² |
| Area Covered (griz) | 24,663, 22,939, 21,283, 22,866 deg² |
| Depth (5σ PSF; griz) | 24.3, 23.9, 23.5, 22.8 mag |
| Depth (5σ AUTO; griz) | 23.9, 23.5, 23.0, 22.4 mag |
| PSF FWHM (griz) | 1.24, 1.10, 1.02, 1.00 arcsec |
| Photometric Uniformity | 7.3 mmag |
| Astrometric Accuracy | 22 mas |
DELVE DR2 Photometric Redshifts
Photometric redshifts for DELVE DR2 are derived by integrating a Recurrent Neural Network architecture with a Mixture Density Network trained on griz magnitudes and colors as described in Teixera et al. 2024. The resulting photo-z information can be accessed from the delve_dr2.photoz table.
DELVE DR1
The first DELVE data release (DELVE DR1; Drlica-Wagner et al. 2021) is hosted at the Astro Data Lab and consists of catalog-level coadds in griz from the DELVE-WIDE processing. DELVE DR1 covers >5,000 deg² in each individual band and ∼4,000 deg² in all bands simultaneously. The DELVE DR1 catalog contains ∼520 million unique objects. The DELVE DR1 catalog-level coadd objects can be accessed through the delve_dr1.objects table.
| DELVE DR1 Summary | |
|---|---|
| Bands | griz |
| Number of Objects | 519,737,142 |
| Area Covered (all bands) | 4,075 deg² |
| Area Covered (griz) | 5,599, 5,106, 5,065, 5,153 deg² |
| Depth (5σ PSF; griz) | 24.3, 23.9, 23.3, 22.8 mag |
| Depth (5σ AUTO; griz) | 23.9, 23.4, 22.9, 22.4 mag |
| PSF FWHM (griz) | 1.28, 1.16, 1.07, 1.04 arcsec |
| Photometric Uniformity | 9.1 mmag |
| Astrometric Accuracy | 22 mas |
Data Reduction
Each subcomponent of DELVE uses slightly different data reduction pipelines, which we describe briefly below. More detailed descriptions of the DELVE data processing can be found in Drlica-Wagner et al. (2021).
- DELVE-WIDE: The DELVE-WIDE data are processed with the DES Data Management (DESDM) pipeline (Morganson et al. 2018). SourceExtractor is used to create catalogs from the reduced ("Final Cut") images, and Gaia DR2 (Gaia Collaboration 2018) is used for astrometric calibration. Photometric calibration is performed with the forward global calibration module (Burke et al. 2018) within the DES footprint and against ATLAS Refcat2 (Tonry et al. 2018) outside the DES footprint. The best references for the DELVE-WIDE processing are the DELVE DR1 paper (Drlica-Wagner et al. 2021) and the DESDM paper (Morganson et al. 2018).
- DELVE-MC: The DELVE-MC images are reduced with the DECam Community Pipeline (Valdes et al. 2014), which is based on an early versions of the DESDM pipeline. The DELVE-MC processing is performed using DELVERED, a modified version of the DAOPhot-based PHOTRED (Nidever et al. 2017), an automated and robust PSF photometry pipeline based on the DAOPHOT suite of programs (Stetson 1987, 1994). Astrometric calibration is performed against Gaia DR2 and photometric calibration is performed against ATLAS Refcat2 (Tonry et al. 2018). The best current reference for the DELVE-MC processing is Nidever et al. (2017).
- DELVE-DEEP: The DELVE-DEEP data have been processed with the DESDM pipeline for image coaddition and simultaneous multi-epoch, multi-object fitting following the same procedure as was used for the DELVE-WIDE processing. Other photometric pipelines for crowded-field photometry are also being explored.
Data Access
The DELVE data are accessible by a variety of means:
Data Lab Table Access Protocol (TAP) service
TAP provides a convenient access layer to the DELVE catalog database. TAP-aware clients (such as TOPCAT) can point to https://datalab.noirlab.edu/tap, select the appropriate DELVE database (e.g., delve_dr3), and see the database tables and descriptions. You can also view the DELVE tables and descriptions in the Data Lab table browser.
Data Lab Query Client
The Query Client is available as part of the Data Lab software distribution. The Query Client provides a Python API to Data Lab database services. These services include anonymous and authenticated access through synchronous or asynchronous queries of the catalog made directly to the database. Additional Data Lab services for registered users include personal database storage and storage through the Data Lab VOSpace.
The Query Client can be called from a Jupyter Notebook on the Data Lab Notebook server. Example notebooks are provided to users upon creation of their user account (register here), and are also available to browse on GitHub at https://github.com/astro-datalab/notebooks-latest.
Image Cutouts
The Data Lab Simple Image Access (SIA) service provides a fast way to retrieve cutouts from DELVE images processed with the DECam Community Pipeline (Valdes et al. 2014). For an example of how to use the SIA service, see this Jupyter notebook. Note that DELVE processes images with the DESDM pipeline (Morganson et al. 2018), which differs slightly from the DECam Community Pipeline.
For DELVE DR3, the SIA URL is:
https://datalab.noirlab.edu/sia/delve_dr3
Jupyter Notebook Server
The Data Lab Jupyter Notebook server (authenticated service) contains examples of how to access and visualize the DELVE catalog:
Acknowledgments
The DECam Local Volume Exploration Survey (DELVE; Proposal ID: 2019A-0305, PI: Drlica-Wagner) is partially supported by Fermilab LDRD (L2019-011), the NASA Fermi Guest Investigator Program (Cycle 9 No. 91201), the NSF AAG (AST-2108168, AST-2108169, AST-2307126, AST-2407526), and the NSF-Simonyi Scholars program.
This project used data obtained with the Dark Energy Camera (DECam), which was constructed by the Dark Energy Survey (DES) collaboration. Funding for the DES Projects has been provided by the U.S. Department of Energy, the U.S. National Science Foundation, the Ministry of Science and Education of Spain, the Science and Technology Facilities Council of the United Kingdom, the Higher Education Funding Council for England, the National Center for Supercomputing Applications at the University of Illinois at Urbana–Champaign, the Kavli Institute of Cosmological Physics at the University of Chicago, the Center for Cosmology and Astro-Particle Physics at the Ohio State University, the Mitchell Institute for Fundamental Physics and Astronomy at Texas A&M University, Financiadora de Estudos e Projetos, Fundação Carlos Chagas Filho de Amparo à Pesquisa do Estado do Rio de Janeiro, Conselho Nacional de Desenvolvimento Científico e Tecnológico and the Ministério da Ciência, Tecnologia e Inovação, the Deutsche Forschungsgemeinschaft and the Collaborating Institutions in the Dark Energy Survey.
The Collaborating Institutions are Argonne National Laboratory, the University of California at Santa Cruz, the University of Cambridge, Centro de Investigaciones Enérgeticas, Medioambientales y Tecnológicas–Madrid, the University of Chicago, University College London, the DES-Brazil Consortium, the University of Edinburgh, the Eidgenössische Technische Hochschule (ETH) Zürich, Fermi National Accelerator Laboratory, the University of Illinois at Urbana-Champaign, the Institut de Ciències de l'Espai (IEEC/CSIC), the Institut de Física d'Altes Energies, Lawrence Berkeley National Laboratory, the Ludwig-Maximilians Universität München and the associated Excellence Cluster Universe, the University of Michigan, the National Optical Astronomy Observatory, the University of Nottingham, the Ohio State University, the OzDES Membership Consortium, the University of Pennsylvania, the University of Portsmouth, SLAC National Accelerator Laboratory, Stanford University, the University of Sussex, and Texas A&M University.
Based in part on observations at Cerro Tololo Inter-American Observatory, National Optical Astronomy Observatory, which is operated by the Association of Universities for Research in Astronomy (AURA) under a cooperative agreement with the National Science Foundation.
Database access and other data services are hosted by the Astro Data Lab at the Community Science and Data Center (CSDC) of the National Science Foundation National Optical Infrared Astronomy Research Laboratory, operated by the Association of Universities for Research in Astronomy (AURA) under a cooperative agreement with the National Science Foundation.